The U.S. economy in 2023 proved more resilient than many economists projected, at least at time of this writing in early October. Inflation has slowed, while domestic GPD and employment gains have continued to defy expectations. That said, major uncertainties loom on the horizon. A potential government shutdown, an escalation of the conflict in Israel, further fallout in China’s economy, and more could all disrupt the economy’s trajectory.
At Glass Magazine and its publisher, the National Glass Association, we regularly track a series of economic and industry trend data to better understand what’s on the horizon for glass companies. We look at macro-economic data points, including unemployment and GDP, right along with construction industry-specific metrics, such as the Architectural Billings Index and the Dodge Momentum Index. Below are three additional data points we’re tracking that offer additional insights into market factors that affect glass companies.
1. Supply chain
One metric our team has been closely watching in the wake of the pandemic is supply chain. The global disruptions in manufacturing and shipping turned all of us into dinner party experts in the fragile nature of supply chains. But thankfully, we have had some increasingly good news from this segment throughout 2023.
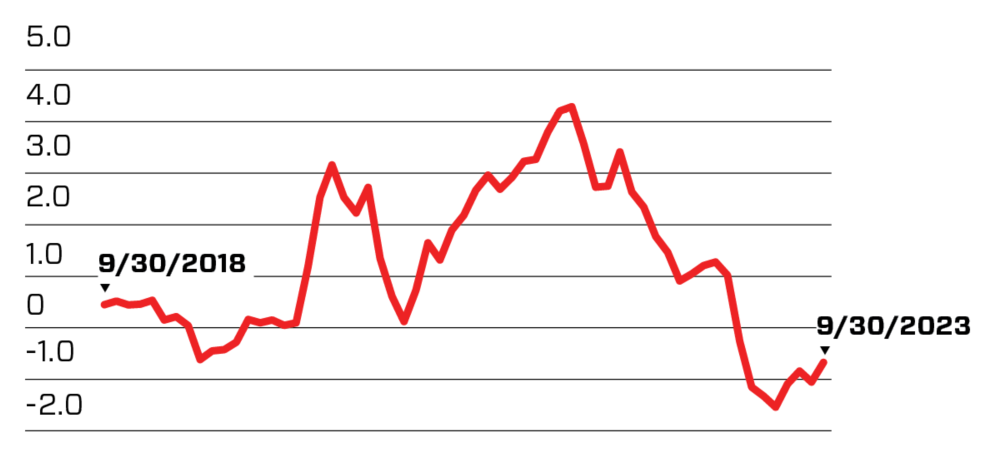
The New York Fed produces a Global Supply Chain Pressure Index, which tracks freight costs, delivery delays reported by manufacturers, and other information about how easy or hard it is for companies to get materials, manufacture products, and transport those products to their destination.
This index hit its lowest point on record in May. It ticked up slightly in the summer and early fall but is still well below pre-pandemic levels.
Global Supply Chain Pressure Index

Freight costs are also back to normal and are down 90% from their peak. To provide some real numbers here: The FBX global container index put the average cost of a shipping container—for all routes across the globe—at $1,088, as of Oct. 6. By comparison, at peak in September 2021, that same container cost more than $11,000.
2. Construction jobs
Data Digest, a weekly newsletter from Ken Simonson, chief economist of the Associated General Contractors of America, provides a regular look at construction employment, with additional context on what this might mean for companies. Construction employment bounced back to pre-pandemic levels in February 2022 and has continued to see gains.
As of September, construction employment totaled 8,014,000 in September, and is up 2.8% year over year. The sector has seen faster employment growth than the rest of the economy, which saw a growth rate of 2.1% for all nonfarm employment, according to Data Digest. Unemployment in the sector among workers with construction experience rose slightly to 3.8 percent, and wages were up 5.5% year over year.
3. Industry investment
Glass Magazine also tracks industry investment trends through its leading market surveys, Top 50 Glaziers, published in July, and Top Glass Fabricators, published in April. Despite uncertain conditions, North American glass companies are growing and investing in their companies.
In our 2023 Top Glass Fabricators survey, 81 percent of fabricators say they plan to invest in capital equipment this year. This comes on the heels of an incredible year for investment in 2022 in which 91% of fabricators said they made capital investments.
Glazing firms are also making investments. The top investments among Top 50 Glazier companies last year were trucks and handling equipment—69% invested in trucks and 63% in handling equipment. Companies also invested in equipment and technology for their shops, in particular software. Fifty-eight percent of glaziers invested in software in 2022.

